
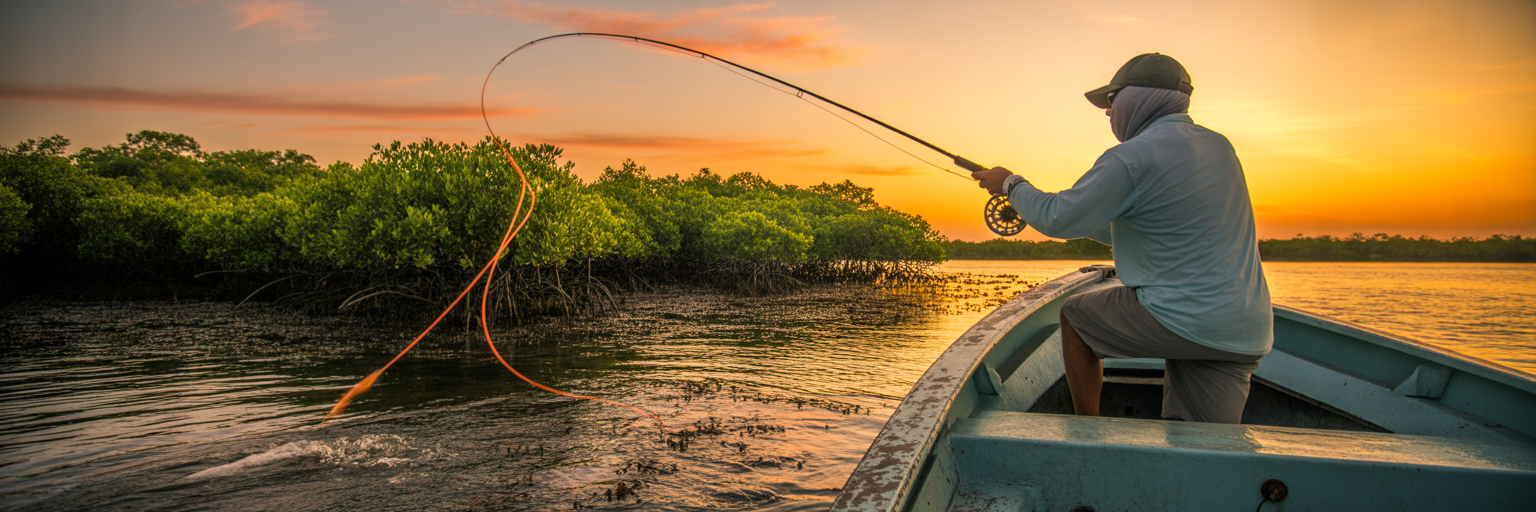
There is a saying every seasoned Florida angler knows by heart: “No run, no fun.” It is the foundational truth of saltwater fishing in our state. This isn’t about having the most expensive rod or the flashiest lure. It is about understanding that moving water is the engine that drives the entire ecosystem. That is why learning how to read Florida tide charts is the single most important skill you can develop to consistently put fish in the boat. Forget luck. This is about strategy.
Think of the tide as a massive conveyor belt. When it moves, it carries baitfish, shrimp, and crabs with it. Predators like snook, redfish, and tarpon are hardwired to take advantage of this delivery service. They position themselves in ambush spots and wait for the food to come to them. An outgoing tide pulls shrimp from a backcountry creek, and a big snook will be waiting at the mouth. The first push of an incoming tide floods a grass flat, and redfish will follow it, ready to hunt for crabs.
Without moving water, these fish are less active. They scatter and conserve energy. The dinner bell is silent. Understanding tides is what separates the angler who gets lucky once in a while from the one who understands where the fish will be and why. It is the difference between a long day of casting at empty water and a trip where every cast feels like it has a purpose.
This is not an academic exercise. This is a practical, no-nonsense Florida fishing tide guide. We are going to break down how to turn the data on a chart into a concrete plan for catching more fish on your next trip.
Why You Must Read Florida Tide Charts
There is a saying every seasoned Florida angler knows by heart: “No run, no fun.” It is the foundational truth of saltwater fishing in our state. This isn’t about having the most expensive rod or the flashiest lure. It is about understanding that moving water is the engine that drives the entire ecosystem. That is why learning how to read Florida tide charts is the single most important skill you can develop to consistently put fish in the boat. Forget luck. This is about strategy.
Think of the tide as a massive conveyor belt. When it moves, it carries baitfish, shrimp, and crabs with it. Predators like snook, redfish, and tarpon are hardwired to take advantage of this delivery service. They position themselves in ambush spots and wait for the food to come to them. An outgoing tide pulls shrimp from a backcountry creek, and a big snook will be waiting at the mouth. The first push of an incoming tide floods a grass flat, and redfish will follow it, ready to hunt for crabs.
Without moving water, these fish are less active. They scatter and conserve energy. The dinner bell is silent. Understanding tides is what separates the angler who gets lucky once in a while from the one who understands where the fish will be and why. It is the difference between a long day of casting at empty water and a trip where every cast feels like it has a purpose.
This is not an academic exercise. This is a practical, no-nonsense Florida fishing tide guide. We are going to break down how to turn the data on a chart into a concrete plan for catching more fish on your next trip.
Decoding the Tide Graph Line by Line
At first glance, a tide graph can look like a confusing squiggle. But it is just a picture of the water level over a 24-hour period. Once you know what to look for, it becomes a simple and powerful tool. Let’s break it down piece by piece.
The Anatomy of a Tide Graph: X and Y Axes
Every tide graph has two main parts. The horizontal line at the bottom, the X-axis, represents time. It is typically marked in hours, showing a full day. The vertical line on the side, the Y-axis, represents water height, usually measured in feet. The wavy line that moves across the graph shows you the predicted water height at any given time of day. Simply find a time on the bottom, trace your finger up to the curve, and then look to the side to see the water level. It is that straightforward.
Key Terms: High Tide, Low Tide, and MLLW
You will see a few key terms on every chart. High Tide is the highest point the water will reach. On the graph, this is the peak of the curve. Low Tide is the lowest point the water will reach, which is the bottom of the trough. These are your two main reference points for the entire day.
You might also see the acronym MLLW, which stands for Mean Lower Low Water. Do not let the technical name throw you. Think of it as the “zero point” on the chart. It is the long-term average of the lower of the two daily low tides. When you see a negative number for a low tide, like -0.5 feet, it just means the water is predicted to be half a foot lower than that average zero point. This is common during strong winter cold fronts and around new or full moons.
Finding Your Prime Time: Calculating Tidal Range and Slope
Here is where the data becomes a fishing plan. First, find the times for high and low tide. Then, look at the water height for each. The difference between the high and low tide height is the tidal range. A bigger number means more water is moving. A 4-foot tidal range will have much stronger currents than a 1.5-foot range.
Now, look at the shape of the curve between the high and low. The steepest parts of the curve show the fastest water movement. The flattest parts, at the very top and bottom, show the slowest movement. The bite almost always happens when the water is moving fastest. Your prime time is the middle of the tide cycle. A good rule of thumb is to focus on the two-hour window in the middle of the rising (incoming) tide and the two-hour window in the middle of the falling (outgoing) tide. This is when the conveyor belt is running at full speed. While we are covering the essentials here, a complete understanding of all available fishing tide charts and their nuances can give you an even bigger edge.
Understanding Water Movement: Tide vs. Current
Now that you can read the lines on the page, we need to clarify a point that trips up many anglers. It is the most important distinction in tidal fishing. Tide is the vertical rise and fall of water. Current is the horizontal flow caused by the tide. You fish the current, not the tide.
Let that sink in. The number on the chart is just a height measurement. The actual flow of water it creates is what triggers fish to feed. When you see a snook holding behind a bridge piling, it is not because the water is two feet high. It is because the current is flowing past that piling, bringing food with it. Understanding the phases of this movement is key.
The Flood Tide is the incoming tide. Water is rising, pushing from the ocean or gulf into the bays, up the rivers, and onto the flats. This current brings clean water and baitfish into the inshore system. It gives fish access to shallow areas they could not reach at low tide.
The Ebb Tide is the outgoing tide. Water is falling, pulling out of the creeks, draining off the flats, and flowing back toward the ocean. This is often the most productive time to fish, as it creates a natural buffet line. Bait that was hiding in the mangroves or up in a creek is forced out into the open, and predators are waiting at these choke points.
Finally, there is Slack Water. This is the short period of calm at the peak of high tide and the bottom of low tide when the water stops moving before changing direction. Think of it as the doldrums of fishing. The current stalls, the conveyor belt stops, and the bite often dies with it. Your chart tells you when slack water will happen, allowing you to take a break, re-rig, or move to a new spot before the current picks up again.
Matching the Tide to Florida Fishing Spots
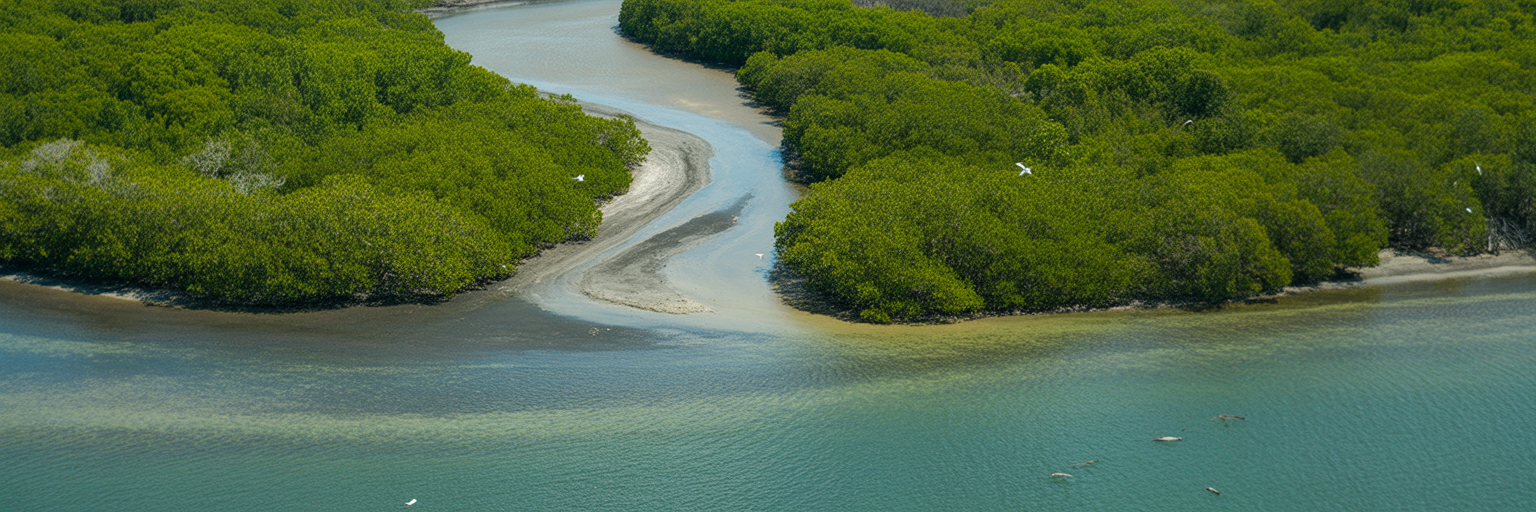
This is where we put it all together. A tide chart is useless unless you can apply it to the specific spot you are fishing. Different habitats fish better on different tides because the current interacts with the structure in unique ways. Here is your tactical playbook for Florida’s key fishing environments.
Incoming Tide Strategy: Flooding the Flats
When the tide starts to rise, it breathes life into shallow grass flats. Redfish, seatrout, and bonefish that were holding in deeper channels during low water now have enough depth to push into the shallows to hunt. The key is to follow the water in.
- Position your boat on the deeper edge of the flat and cast toward the shallowest water where you see signs of life.
- Look for “nervous water” or tailing fish as they forage for crabs and shrimp in the new depth.
- As the tide rises, move further onto the flat, staying with the fish as they push shallower.
Outgoing Tide Strategy: Choke Points and Passes
An outgoing tide acts like a funnel, concentrating bait and predators into predictable locations. This is when inlets, passes, and bridges become prime ambush points. The best tide for snook fishing is almost always a strong outgoing tide at one of these spots. These outgoing tide fishing spots are magnets for gamefish.
- Set up down-current from structure like bridge pilings, dock lights, or rock jetties.
- Cast your lure or bait up-current and let the flow sweep it naturally past the ambush point.
- Pay close attention to current seams, where fast and slow water meet. Predators love to hold on these edges.
Draining Mangroves and Creeks: The Last of the Ebb
The last two hours of a falling tide can be magical along mangrove shorelines and in backcountry creeks. As the water recedes, it forces every shrimp, crab, and small baitfish out from under the mangrove roots and from deep within the creek systems.
- Focus on the mouths of small creeks and any points or cuts along the shoreline.
- Fish are waiting at these exit points for an easy meal to be washed out to them.
- This is a classic pattern for snook, juvenile tarpon, and redfish.
Offshore and Nearshore Structure: Current is King
Tide is just as important offshore, but we think about it purely in terms of current. Whether the tide is incoming or outgoing, the strongest current of the day will position fish on structure like wrecks and reefs. Grouper, snapper, and amberjack will face into the current, waiting for bait to be swept to them.
- Use your bottom machine to find which side of the wreck the fish are holding on.
- Anchor your boat up-current from the structure.
- Drop your baits back so they drift naturally to where the fish are staged. No current often means no bottom fish bite.
| Spot Type | Best Tide Phase | Target Species | Angler’s Play |
|---|---|---|---|
| Shallow Grass Flats | Mid-to-High Incoming | Redfish, Seatrout, Bonefish | Position on the edge and cast into the flooding shallows. |
| Inlets, Passes & Bridges | Mid-to-Low Outgoing | Snook, Tarpon, Jack Crevalle | Fish down-current of structure where bait is funneled. |
| Mangrove Shorelines & Creeks | Last 2 Hours of Outgoing | Snook, Juvenile Tarpon, Redfish | Target creek mouths and points where bait is flushed out. |
| Offshore Reefs & Wrecks | Strongest Current (Either Way) | Grouper, Snapper, Amberjack | Anchor up-current and drop baits back to the structure. |
This table provides a quick-reference guide for matching your fishing location to the most productive part of the tide cycle. These are proven starting points, but always be ready to adjust based on what you see on the water.
Advanced Factors: The Influence of Moon and Wind
The tide chart is an excellent prediction, but it is not absolute. Two major forces, the moon and the wind, can alter the water levels and currents you experience on the water. The best anglers know how to read the chart and then adjust for reality.
First, let’s talk about the moon. The moon’s gravitational pull is the primary driver of the tides. Its phase directly impacts the strength of the currents. During a new moon and a full moon, the sun and moon are aligned, and their combined gravity creates stronger tides. These are called Spring Tides. You will see higher high tides, lower low tides, and much faster currents. These ripping tides are great for fishing choke points where fish are forced into tight areas, but they can make flats muddy and difficult to fish.
During the first and third quarter moons, the sun and moon are at right angles to each other, and their gravitational pulls partially cancel each other out. This creates weaker tides known as Neap Tides. The tidal range is smaller, and the currents are slower. Neap tides are excellent for sight-fishing on the flats because the water is generally clearer and moves more slowly, giving you a better chance to spot fish. As explained in NOAA’s educational resources, these gravitational forces are what create the predictable daily and monthly tidal variations.
Wind is the other major factor. A strong, sustained wind can literally push water around, overriding the predicted tide. A hard onshore wind blowing for a day or two can “dam up” the water in a bay, preventing the low tide from getting as low as the chart says. Conversely, a strong offshore wind can blow water out, making the low tide even lower and preventing the high tide from coming in all the way. The chart is your plan, but your eyes are the final authority. If the wind has been howling from the east for two days, you must anticipate that the water on the east side of the bay will be higher than predicted, and you have to adjust your strategy.
Your Pre-Trip Tide Planning Checklist
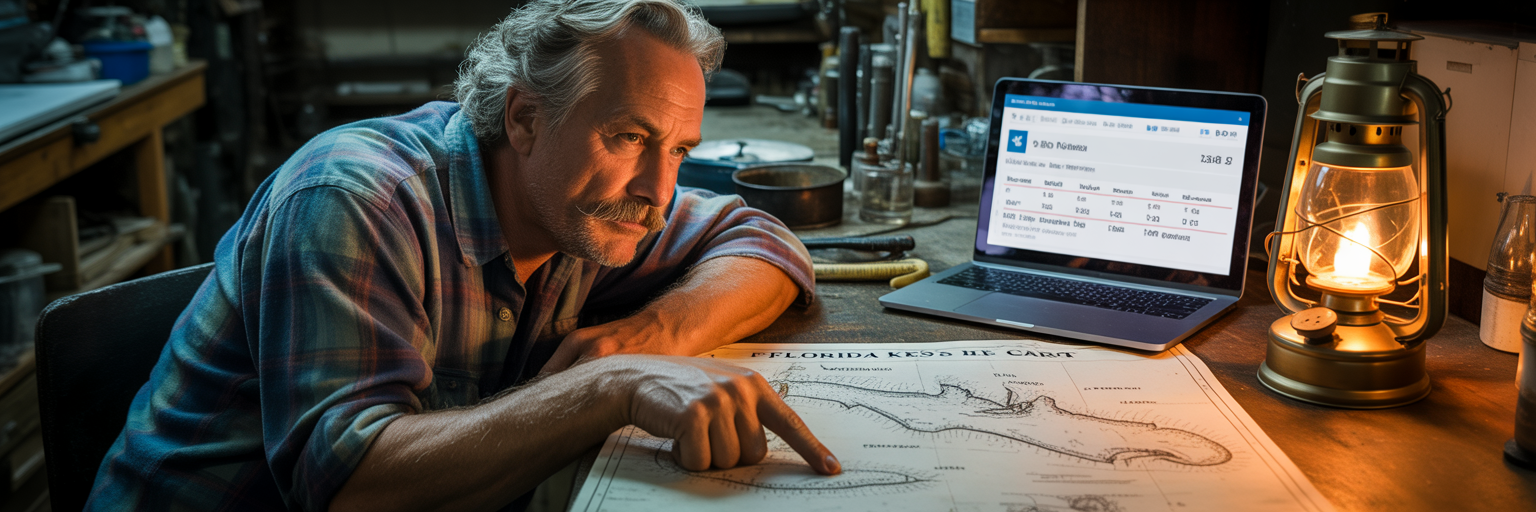
A successful day on the water starts before you ever leave the house. Turning tidal data into a real plan requires a methodical approach. Running through this simple checklist will prevent common mistakes and ensure your saltwater tide planning is sound. Do these five things before every trip.
- Select the Correct NOAA Station. This is the most common mistake. A tide station at an ocean inlet can be more than an hour different from a station located ten miles back in a bay. Choose the station closest to where you plan to fish. If you are fishing multiple spots, check the charts for each one.
- Verify the Date and Time. It sounds simple, but it is easy to look at yesterday’s or tomorrow’s chart by mistake. Double-check the date. Also, confirm you are accounting for Daylight Saving Time if the chart uses a standard time format.
- Identify Prime Time Windows. Do not just look at the high and low. Find the mid-points of the rising and falling tides. These are your target windows. Plan your day around being at your best spots during these periods of strong current.
- Cross-Reference with the Weather. Look at the wind forecast. Note the speed and direction. Ask yourself: “How will a 15 mph northeast wind affect my spot?” Will it make the tide higher or lower than predicted? Will it make the water too rough to fish effectively?
- Confirm Access and Navigability. Check the height of the low tide. Is it going to be low enough to prevent you from launching your boat or getting out of a canal? Will that flat you want to fish be completely dry? A negative low tide can leave you stranded if you are not careful.
Building Your Tidal Game Plan
Mastering the tides is about combining all these elements into a cohesive game plan for the day. It is about thinking through the entire tide cycle and matching it to the spots you want to fish. You stop reacting and start anticipating.
A solid game plan might look something like this: “The tide starts rising at 7 AM. I will start the morning on the outside edge of the flats near the pass, catching the first push of incoming water. As the tide gets higher around 9 AM, I will move onto the flat itself to look for tailing reds. The tide peaks at noon, so I will use that slack period to move to a creek mouth. As the tide starts falling hard around 1 PM, I will be in position to intercept the snook and jacks getting washed out of the creek.”
That is a plan driven by the tide. However, the most critical part of any game plan is flexibility. The chart is your guide, but the fish have the final say. Always be observing. Look for current seams, diving birds, nervous water, or bait being pushed to the surface. If you have a plan to fish an outgoing tide at a bridge, but you see birds working over a flat on your way there, be willing to abandon the plan. The fish are telling you where the bite is happening right now.
Reading tides is a skill built over time on the water. Start by using this guide to build your plan. Then, pay close attention to what you see during your trip. Compare your observations to the chart. With each trip, your understanding will deepen. You will stop relying on luck and start creating your own, consistently.