
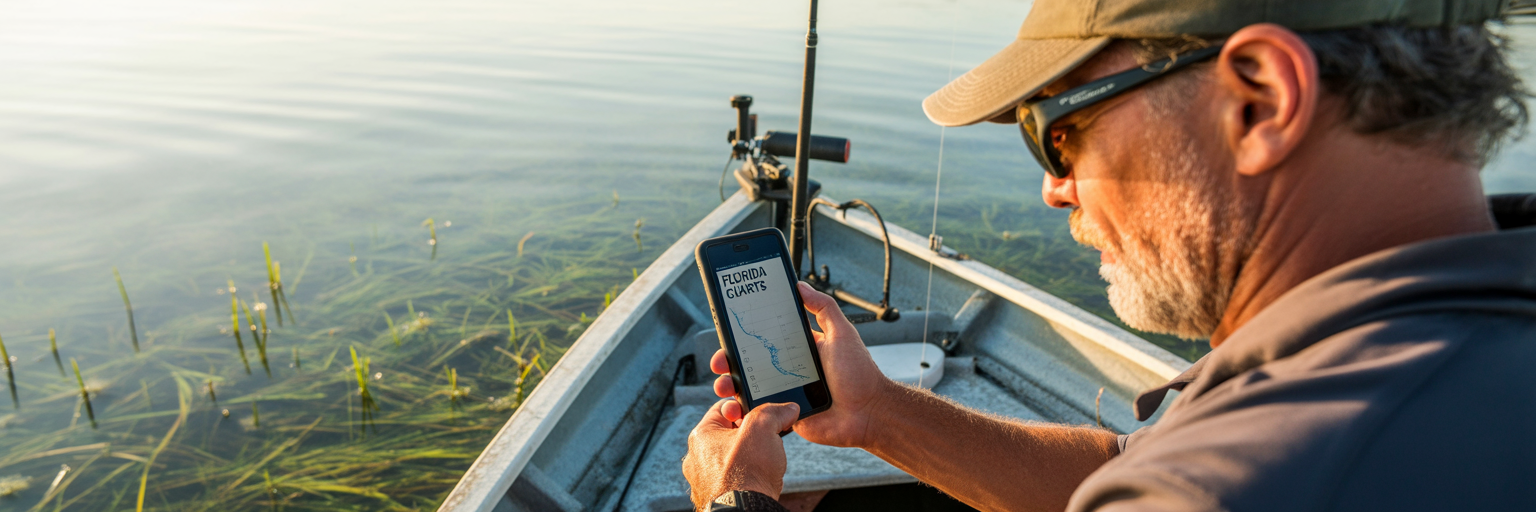
Every Florida angler knows the moment. One minute, you are casting into dead water. The next, it is like a light switch flips and every fish in the area decides to eat. That switch is almost always thrown by water movement. Understanding and predicting this movement is the single most important part of successful saltwater fishing, and modern Florida tide chart apps put that power right in your pocket. For species like snook, redfish, and tarpon, it is not just about high or low tide. It is about the push, the velocity of the current that gets bait moving and triggers predators to set up on ambush points.
Not long ago, our dashboards were littered with laminated paper charts, dog-eared and stained with salt spray. They gave us the basic highs and lows, but they were static. Today’s tools are dynamic. The best apps integrate real time data, offering portability and a stream of information like wind and weather that was impossible with old charts. They present data in ways that help you truly understand what the water is doing. For anglers who want to master the fundamentals, learning how to interpret fishing tide charts is a critical first step.
Many anglers wonder if they need to pay for a quality service. The answer is no. The market is full of powerful, free fishing tide charts that are more than capable of handling serious Florida fishing trip planning. These apps are typically supported by ads or offer premium features for a fee, but their core functionality is robust. They provide the essential data you need to get on the fish. But let’s be clear: an app is a tool to increase your odds, not a crystal ball. Its job is to put you in the right place at the right time. Your skill, observation, and ability to adapt on the water are what will always seal the deal.
Core Features of a Reliable Tide App
Once you understand that tide drives the bite, the next step is choosing the right tool for the job. Not all tide apps are created equal, and some are little more than digital novelties. A serious angler needs an app that delivers accurate, actionable data without fail. When evaluating options, focus on the core features that directly translate to catching more fish. Forget the flashy graphics and “bite scores” for a moment. The best tide app for Florida fishing is the one that gets the fundamentals right, every single time.
Offline Functionality for Remote Waters
Florida’s most productive fishing often happens where cell towers are a distant memory. Think of the backcountry of the Ten Thousand Islands, the remote flats of the Mosquito Lagoon, or the far reaches of the Gulf. In these places, an app that requires a constant internet connection is a useless liability. A reliable app must have offline functionality. This is achieved by storing NOAA harmonic predictions locally on your device, allowing you to access tide graphs and station data even when you are completely off the grid. Before you trust an app, put your phone in airplane mode and see if it still works. If it does not, find another one.
Clean, Readable Tide Graphs
The heart of any tide app is its graph. This visual representation of water movement tells you everything you need to know about the day. Look for a clean, simple interface. You want a clear curve showing the precise times and heights of the highs and lows. More importantly, pay attention to the steepness of that curve. A steep line between a high and low tide indicates a rapid change in water level and, therefore, a faster current. These periods of strong flow are often the most productive times to fish choke points like passes, bridges, and inlets where predators wait for bait to be swept to them.
Tide Height vs. Tidal Current Data
This is a distinction that many novice anglers miss, but it is absolutely critical. Tide height tells you the vertical water level. This is essential for knowing if you can get your boat onto a shallow flat without running aground or if an oyster bar will be exposed. Tidal current, on the other hand, tells you the horizontal speed and direction of the water. This is what dictates how fish will position themselves on structure. An app should provide both. Current data, usually shown in knots, lets you predict exactly how a redfish will sit on the down current side of a piling, waiting for an easy meal.
Customizable, Actionable Alerts
A great tide app should work for you, not the other way around. The best ones allow you to set custom alerts that turn the app into an active fishing partner. Instead of constantly checking your phone, you can set a notification for key events. Imagine getting an alert one hour before low tide, reminding you it is time to move to the mouth of a creek where bait will be pouring out. Or an alert that tells you when the water reaches a specific height, signaling the perfect time to start poling a particular flat. This feature transforms the app from a passive reference tool into a proactive part of your fishing strategy.
| Feature | Why It’s Critical for Florida Anglers | What to Look For |
|---|---|---|
| Offline Access | Cell service is nonexistent in many prime fishing areas like the Everglades or remote flats. | The app should store NOAA harmonic predictions locally on your device. |
| Specific NOAA Station Selection | A generic ‘Tampa Bay’ tide is useless; you need data for the specific flat or pass you’re fishing. | A map interface allowing you to pick the closest primary or subordinate station. |
| Tidal Current Data | Tells you the speed and direction of water movement, which dictates where fish set up to ambush bait. | Separate graphs or map overlays showing current velocity (in knots) and direction. |
| Wind Data Overlay | Wind can drastically alter predicted tide heights and times, ‘blowing out’ a flat or ‘stacking’ water. | An overlay on the tide graph showing wind speed and direction for the day. |
| Customizable Alerts | Turns the app into a proactive tool, notifying you of prime conditions so you don’t miss a window. | Ability to set notifications for specific tide heights, times, or stages (e.g., ‘1 hour before low tide’). |
Advanced Data for Pinpoint Accuracy
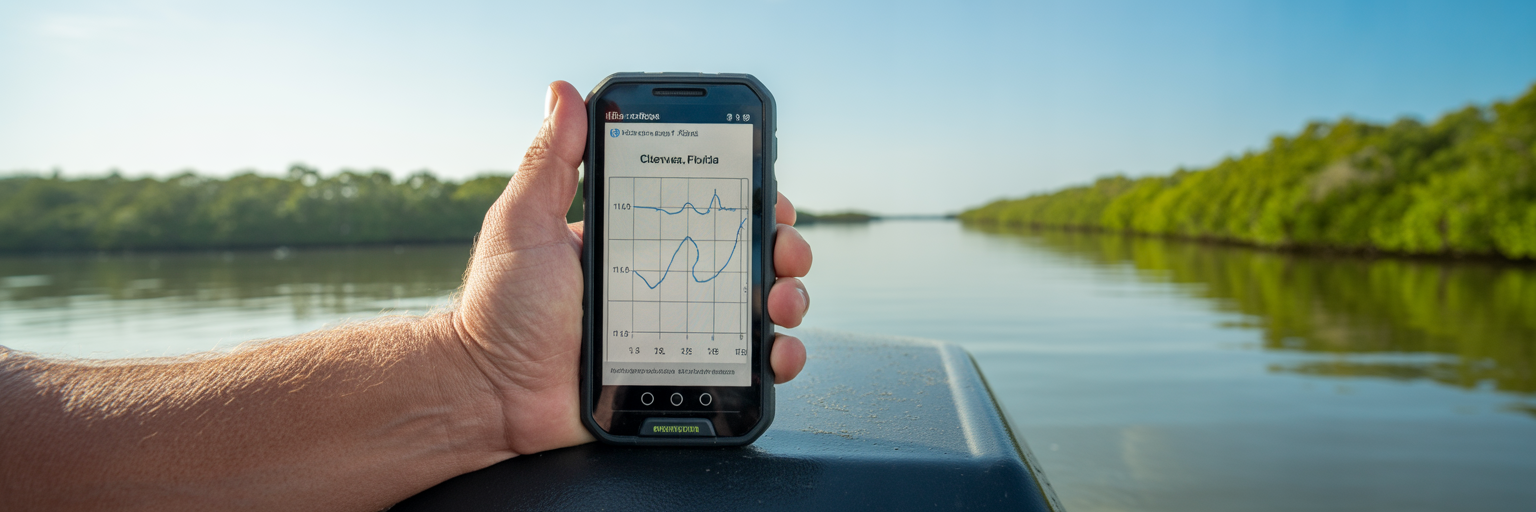
Once you have an app that nails the basics of tide and current, you can start layering in other data streams to refine your plan. This is where you move from simply being in the right area to being on the exact spot at the perfect time. These advanced metrics help you understand the subtle environmental factors that can turn a good day into an epic one. Learning how to read tide charts for fishing is not just about the tide itself. It is about seeing how the tide interacts with wind, pressure, and temperature.
Wind’s Impact on Tides
A tide chart is a prediction, but wind is a reality. A strong, sustained wind can completely override a predicted tide. We call this a “wind blown tide.” For example, a stiff 20 knot east wind on the Atlantic coast can hold water in against the shore, significantly delaying the predicted low tide and keeping water levels higher than expected. Conversely, a strong west wind on the Gulf coast can blow water out, creating an abnormally low tide. A good app will overlay wind speed and direction on the tide graph, allowing you to anticipate these changes and adjust your plan accordingly.
Barometric Pressure Trends
Fish are incredibly sensitive to changes in atmospheric pressure. While many apps show the current barometric pressure, the real secret is in the trend. A steady or rising barometer often corresponds with stable weather and average fishing. However, a sharply falling barometer, which typically occurs ahead of an approaching cold front or storm system, can trigger an aggressive feeding response. Fish sense the coming change and feed heavily. Your app should show a pressure graph for the day. Look for those downward trends as a sign to be on the water.
Sea Surface Temperature (SST) and Salinity
These two factors are huge, especially when targeting specific species. Offshore, anglers use SST charts to find temperature breaks, which are edges where cold and warm water meet. These breaks concentrate bait and attract pelagic predators like mahi mahi and tuna. Inshore, salinity is key. After a heavy rain, freshwater runoff can push snook and tarpon out of the upper estuaries and toward the inlets where the water is saltier. Some advanced apps provide SST and salinity overlays, giving you a massive advantage in locating fish.
Moon Phase and Solunar Tables
The moon’s gravitational pull is the primary force behind the tides. The strongest tides, known as spring tides, occur during the new and full moon phases. Weaker tides, or neap tides, happen during the quarter moons. Your app should clearly display the moon phase. This helps you anticipate the overall strength of the current for the day. Solunar tables, which predict major and minor feeding periods based on the moon’s position, can also be useful. Think of them as a tie breaker. If the tide, wind, and pressure all look good, and you are in a major solunar period, your confidence should be high.
Station Accuracy and Local Adjustments
The most common mistake anglers make with tide apps is relying on data from the wrong location. Water does not move uniformly across a large area like Tampa Bay or the Indian River Lagoon. A tide prediction for a main inlet can be hours different from the tide on a backwater flat just a few miles away. This is why station selection and understanding how to make local adjustments are paramount for accurate planning. Your app is only as good as the data source you choose.
NOAA provides the data for nearly all tide apps, and it comes from two types of locations: primary and subordinate stations. Primary stations have physical gauges that record real time water levels. Subordinate stations are calculated mathematically based on the data from a nearby primary station, with offsets for time and height. When you choose a spot in your app, you must select the absolute closest station, whether primary or subordinate, to where you plan to fish. A generic “Miami” tide is useless if you are fishing a specific flat in northern Biscayne Bay. Drill down on the map and find the station named for the creek, point, or island you will be on.
Even with the right station, you still need to think like a fish. Use the satellite map layer in your app to study the local geography. Water flows faster through a narrow pass than it does across a wide, open basin. A shallow flat will drain much quicker than a deep channel. By visualizing how the water will be forced to move around points, islands, and oyster bars, you can make mental adjustments to the app’s predictions. This is the art of blending data with waterman’s intuition.
Finally, always cross reference the NOAA tide predictions Florida provides with the day’s weather. That steady 20 knot onshore wind we talked about does more than just stack up water. It can make a shoreline unfishable due to waves and dirty water, even if the tide is perfect. If the app predicts a 1.5 foot low tide but you have a hard onshore wind, you should mentally adjust your expectation. The water will likely stay higher, and you might be able to access areas you thought would be dry. This skill of interpreting data in the context of real world conditions is what separates consistently successful anglers from the rest.
From Screen to Water: Ground-Truthing Your Plan
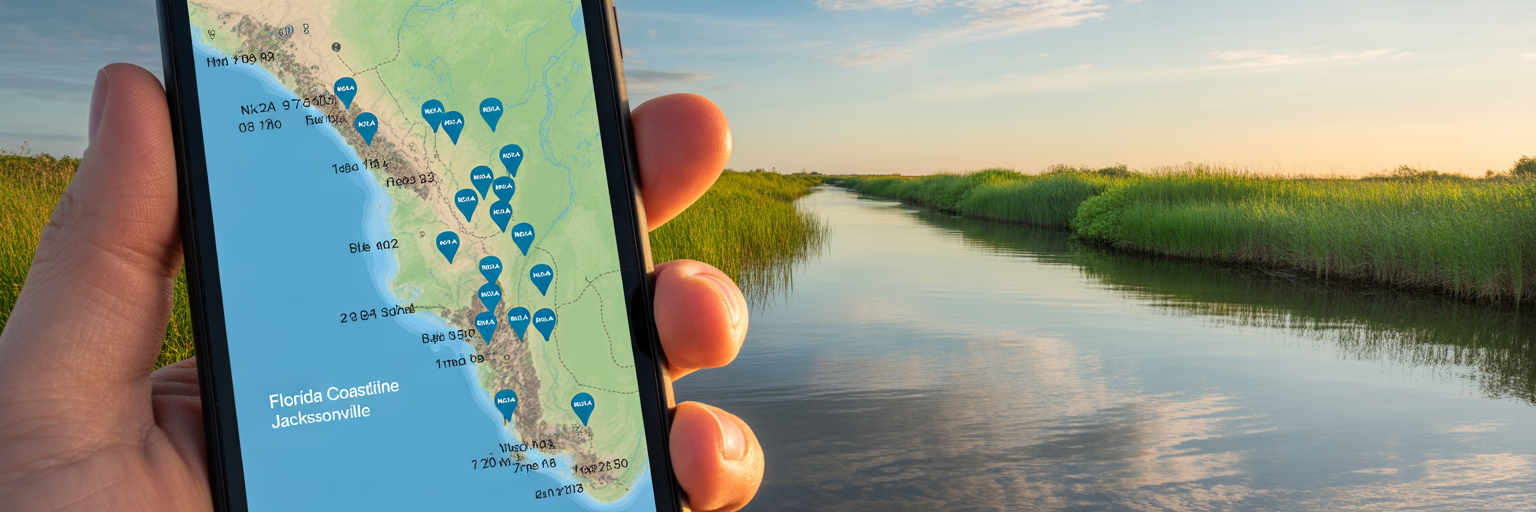
Your homework is done. You have picked the right tide, cross referenced it with wind and pressure, and selected the perfect station. But the plan is not complete until you have confirmed it with your own eyes. The most sophisticated app in the world is no substitute for direct observation. This process of “ground truthing” is the final and most critical bridge between your digital plan and the reality on the water. It is where you confirm your predictions and adapt if they do not match what you see.
This starts with the ramp check. Before you even unhook the trailer, take a minute to observe. Look at a piling, a seawall, or the ramp itself. Is the water level where the app predicted it would be? Is the current moving in the expected direction? Is the water clarity good, or has the wind churned it into chocolate milk? If what you see does not align with your app’s forecast, you must be ready to adapt your plan immediately. Maybe the wind held the tide in, and your first spot is still too deep. It is better to know that now than after a long run across the bay.
As you run to your spot, keep your eyes open. A perfect tide is useless if there are no signs of life. Look for baitfish flickering on the surface, birds diving, or the telltale push of a school of mullet. These are the signs that the ecosystem is active. Many apps include a “bite score” or “fishing forecast” feature. Treat these with skepticism. They are based on algorithms that weigh various data points, but they cannot see a flock of terns working over a school of pilchards. Always trust your eyes and your gut over a computer generated score.
Finally, and this is non negotiable, the last step of any trip plan is a final check of the fishing regulations. An app will not tell you that gag grouper season closed last week or that the slot limit for redfish changed. Your license and your privilege to fish depend on you knowing and following the rules. Before you launch, take two minutes to check the current, official Florida Fish and Wildlife Conservation Commission (FWC) regulations. A pre launch checklist makes this process automatic:
- Ramp Check: Does the water level, current, and clarity match the forecast?
- Signs of Life: Are birds, bait, or other signs of an active ecosystem present?
- Gut Check: Does the spot look and feel “fishy” based on your experience?
- Regulations Check: Have you confirmed the current FWC rules for your target species?
Building a Confident Trip Plan
Using Florida tide chart apps effectively is about building a repeatable process that increases your odds of success on every trip. It is about moving beyond just looking at a high or low time and developing a comprehensive understanding of the marine environment. By layering data and ground truthing your plan, you build confidence and eliminate guesswork. This systematic approach is the foundation of all successful Florida fishing trip planning.
Think of it as a simple workflow:
- Days Out: Scan the week ahead in your app. Identify days with strong tidal movements that coincide with favorable winds and your personal schedule.
- Night Before: Finalize your plan. Choose your primary and secondary spots based on the refined tide and weather forecast. Select the closest tide stations for each spot.
- Pre-Launch: Perform your final checks. Review the official FWC regulations for your target species.
- At the Ramp: Ground truth your plan. Observe the actual water conditions and be prepared to adapt if they differ from the forecast.
It is helpful to apply the 80/20 rule to fishing data. Roughly 80% of your success will come from correctly timing the water movement. That is the tide and current. The other 20% comes from fine tuning with secondary factors like barometric pressure, moon phase, and water temperature. Do not get lost in the weeds and suffer from “analysis paralysis.” Nail the tide, and you are most of the way there.
After each trip, take five minutes to conduct a post trip review. How accurate was the app’s prediction? Did the bite turn on when you expected? Making notes on what actually happened versus what was predicted is how you build true local knowledge. This process turns every day on the water, good or bad, into a valuable lesson. The ultimate goal is to maximize efficiency. It is about spending less time searching dead water and more time with a bent rod, making targeted casts during the most productive windows of the day.